
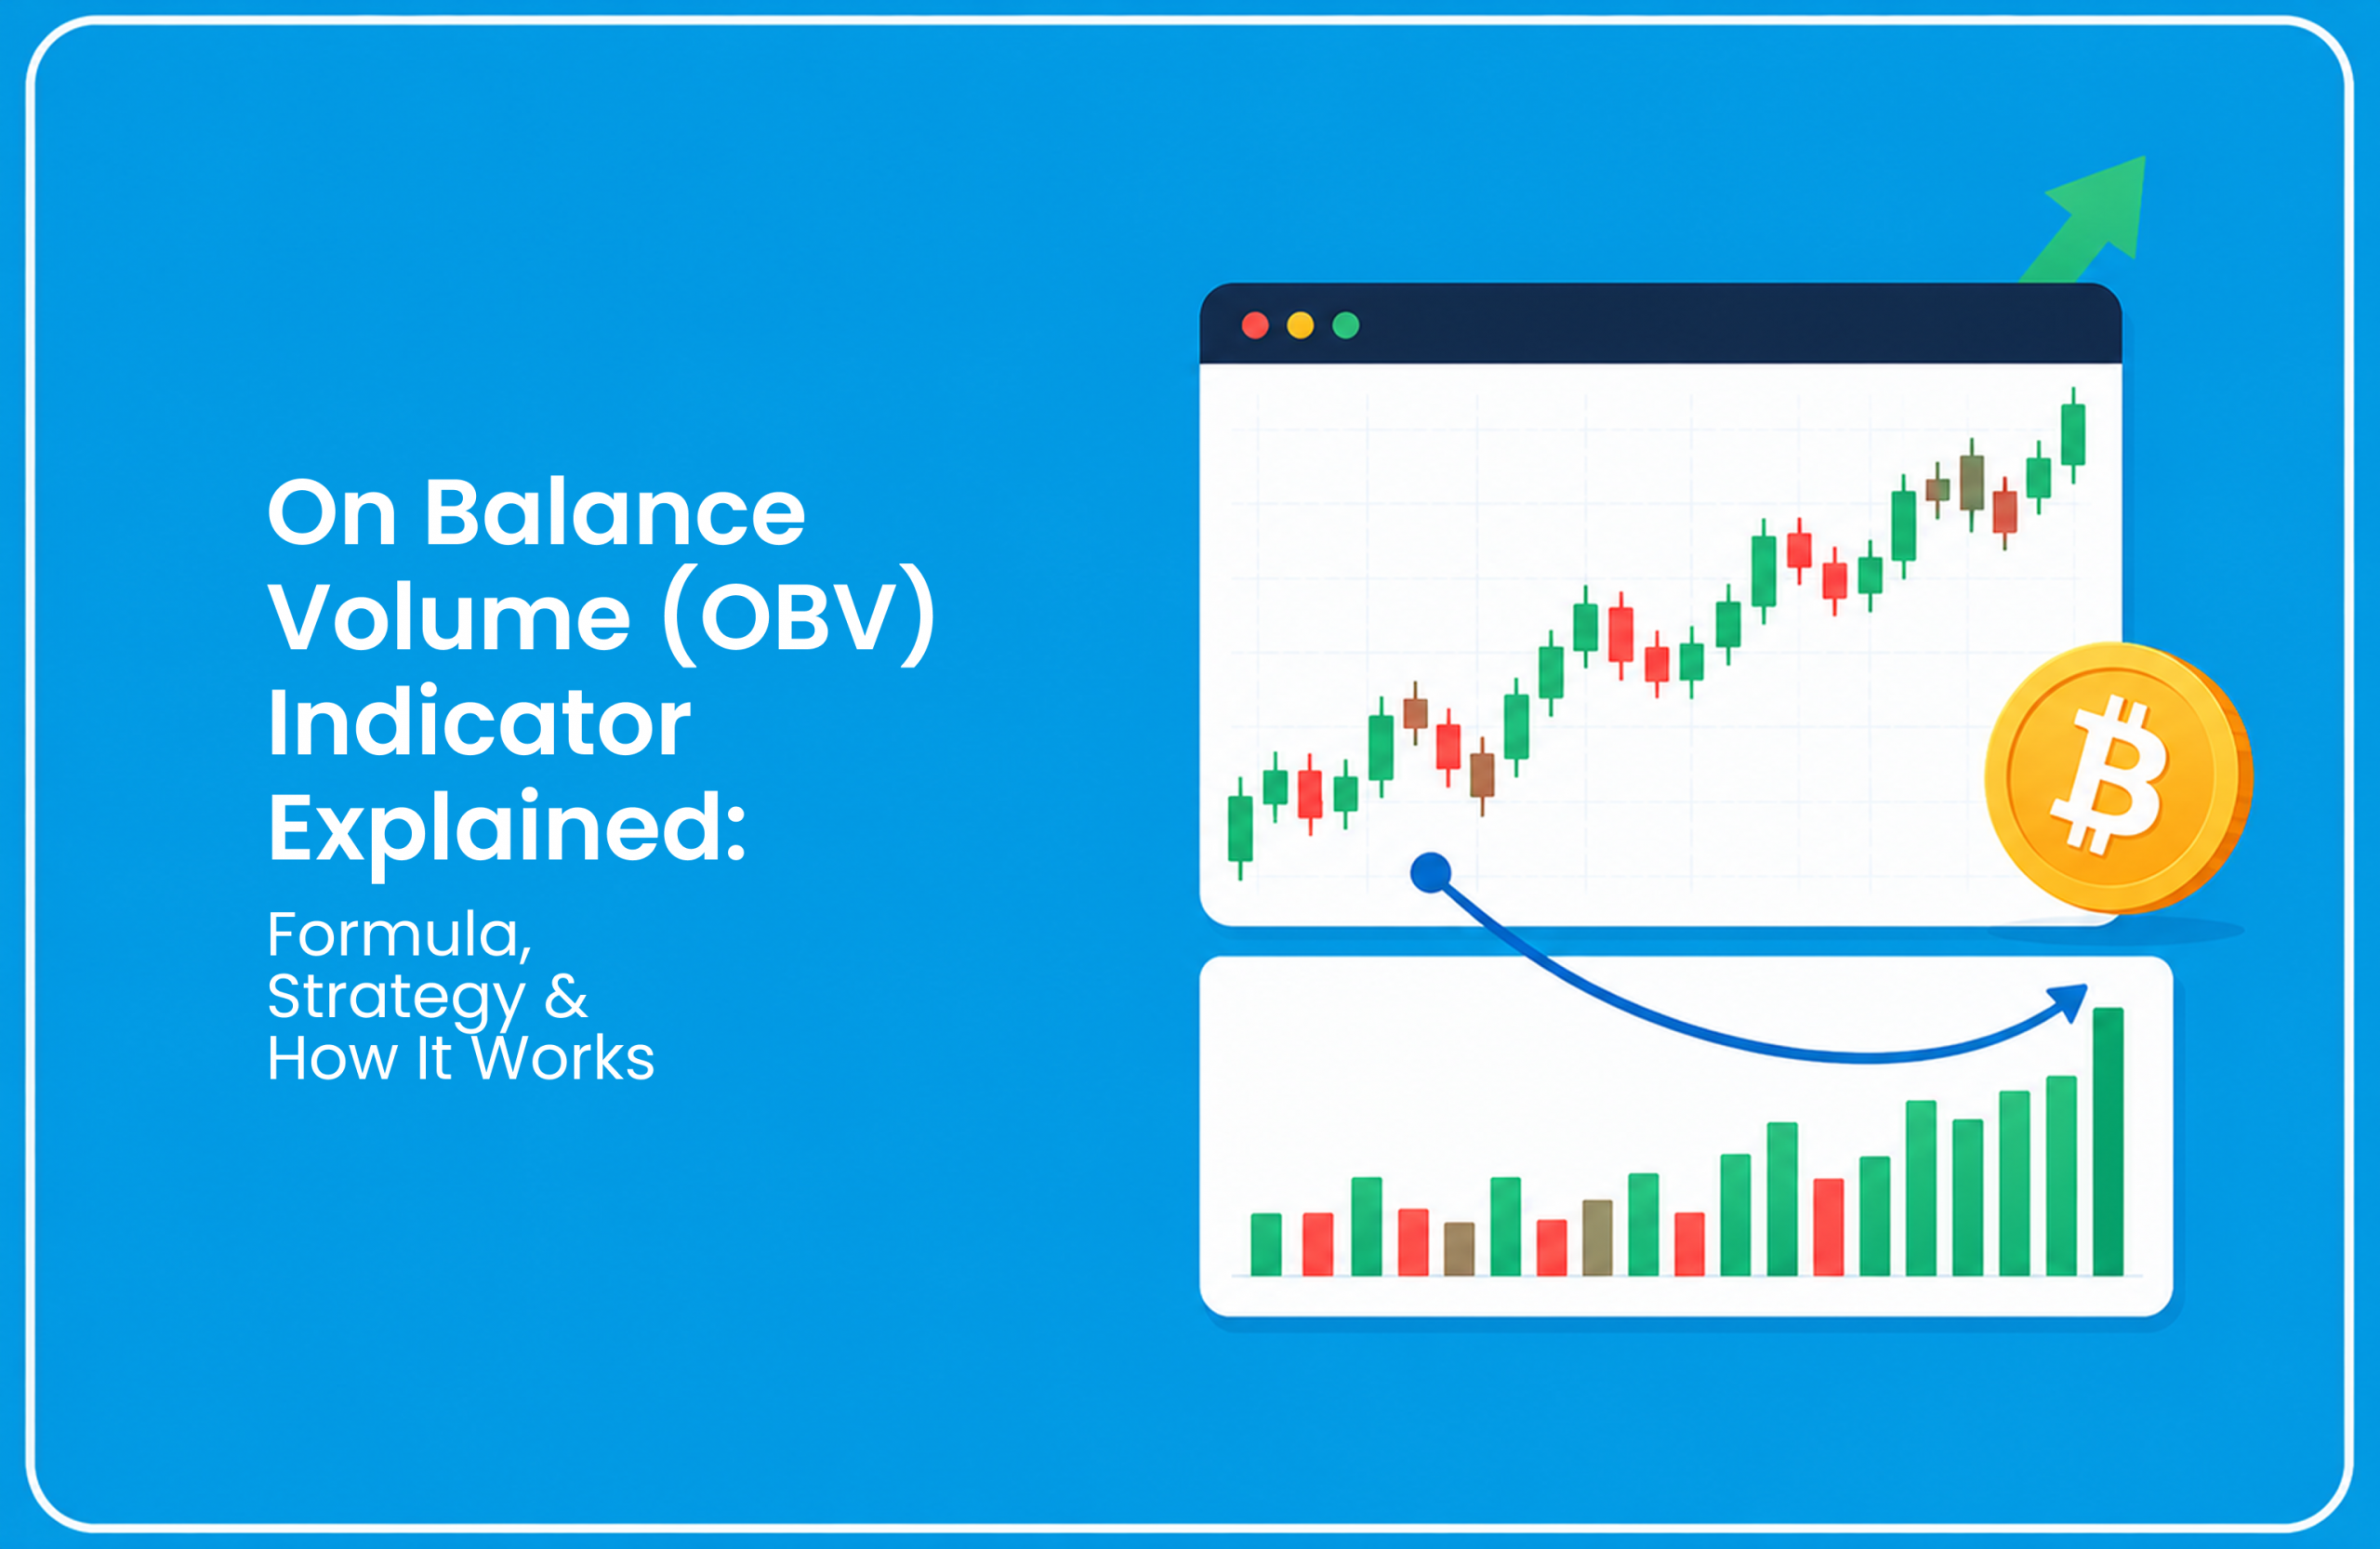
To answer what is On Balance Volume (OBV), it is a momentum-based technical analysis tool that links trading volume to price movement. Introduced by Joseph Granville, OBV full form is On Balance Volume, and it operates on a simple idea: volume precedes price.
The on-balance volume indicator is a cumulative metric, which means it builds up or down over time rather than resetting each session.
How the OBV Indicator Works
Understanding how OBV indicator works starts with recognising its core logic. When each trading session closes, the indicator checks whether the price has moved higher or lower than the previous session’s close.
- If the prrice closes higher, the session’s full volume is added to the running OBV total.
- If the price closes lower, the session’s full volume is subtracted from the running OBV total.
- If the price closes unchanged, the OBV value remains the same.
When large participants accumulate positions, volume on up days tends to outstrip volume on down days, pushing OBV upward even before price breaks out decisively. This feature makes the OBV a valuable signal for crypto trading for beginners.
On Balance Volume Formula
The on-balance volume formula is among the most accessible in technical analysis:
OBV = Previous OBV + Current Volume (if close > previous close)
OBV = Previous OBV – Current Volume (if close < previous close)
OBV = Previous OBV (if close = previous close)
How to Read the OBV Indicator
An integral part of learning how to read OBV involves focusing on three core patterns.
Rising OBV
A sustained upward slope in OBV means that volume is heavier on up days than on down days. When price also trends higher in parallel, this uptrend carries conviction.
Falling OBV
A declining OBV means distribution: down-day volume consistently outpaces up-day volume. A falling OBV during a trading range can signal a downside breakout.
OBV Divergence
Divergence between OBV and price points to one of the strongest signals the indicator produces.
- Bullish divergence: Price falls to a new low, but OBV holds above its prior trough. This suggests selling pressure is fading, and a reversal may follow.
- Bearish divergence: Price rises to a new high, but OBV fails to confirm. This is a warning that buying conviction is weakening and a pullback might be necessary.
Pairing these divergences with the CMF indicator (Chaikin Money Flow) can give you confirmation of money flow direction.
OBV Indicator Strategy
Learning how to use OBV indicator in live markets focuses on two primary frameworks:
Trend Confirmation
When price and OBV both move in the same direction, the trend is considered healthy.
Breakout Validation
A price breakout above resistance doesn’t mean much if OBV does not confirm it. A genuine breakout should coincide with a surge in OBV.
OBV in trading is not limited to stocks. Crypto markets provide a good playing field for OBV-based signals. On platforms offering derivatives, combining OBV signals with the ADX indicator helps understand both trend direction and strength simultaneously.
Why OBV Still Matters?
The OBV indicator remains a trusted technical analysis tool because its core logic works across markets and timeframes.
Traders can apply it to spot volume-backed trends and stronger breakout signals with more confidence.
On Shark Exchange, USDT-denominated futures and options offer a precise setup for strategy-driven trading, while the platform also allows Indian users to deposit and withdraw directly in INR via UPI and IMPS, completely removing forex hassles.
FAQ’s – OBV Indicator
1) What is the OBV indicator in trading?
The OBV (On Balance Volume) indicator is a momentum-based tool introduced by Joseph Granville that links trading volume with price movement to identify accumulation or distribution trends.
2) How does the OBV indicator work?
OBV adds volume when price closes higher and subtracts volume when price closes lower, creating a cumulative line that reflects buying or selling pressure over time.
3) What is OBV divergence?
OBV divergence occurs when price and OBV move in opposite directions, indicating weakening momentum and a possible trend reversal.
4) How is OBV used in trading strategies?
OBV is commonly used for trend confirmation and breakout validation, helping traders confirm whether price movements are supported by strong volume.
5) Which indicators work best with OBV?
OBV works well with indicators like ADX for trend strength and CMF for volume flow confirmation, providing a more complete market analysis.