
The ADX indicator, also known as the average directional index, is a technical analysis tool by J. Welles Wilder.
The question, “What is the ADX indicator?” often comes to mind when working with commodity markets. It is designed to measure the strength of a market trend.
This indicator is made from a systematic, rules-based market analysis framework that has been adopted across various asset classes.
How the Average Directional Index (ADX) Works
A high ADX reading does not tell a trader whether the price is rising or falling. It simply conveys that a trend is gathering momentum.
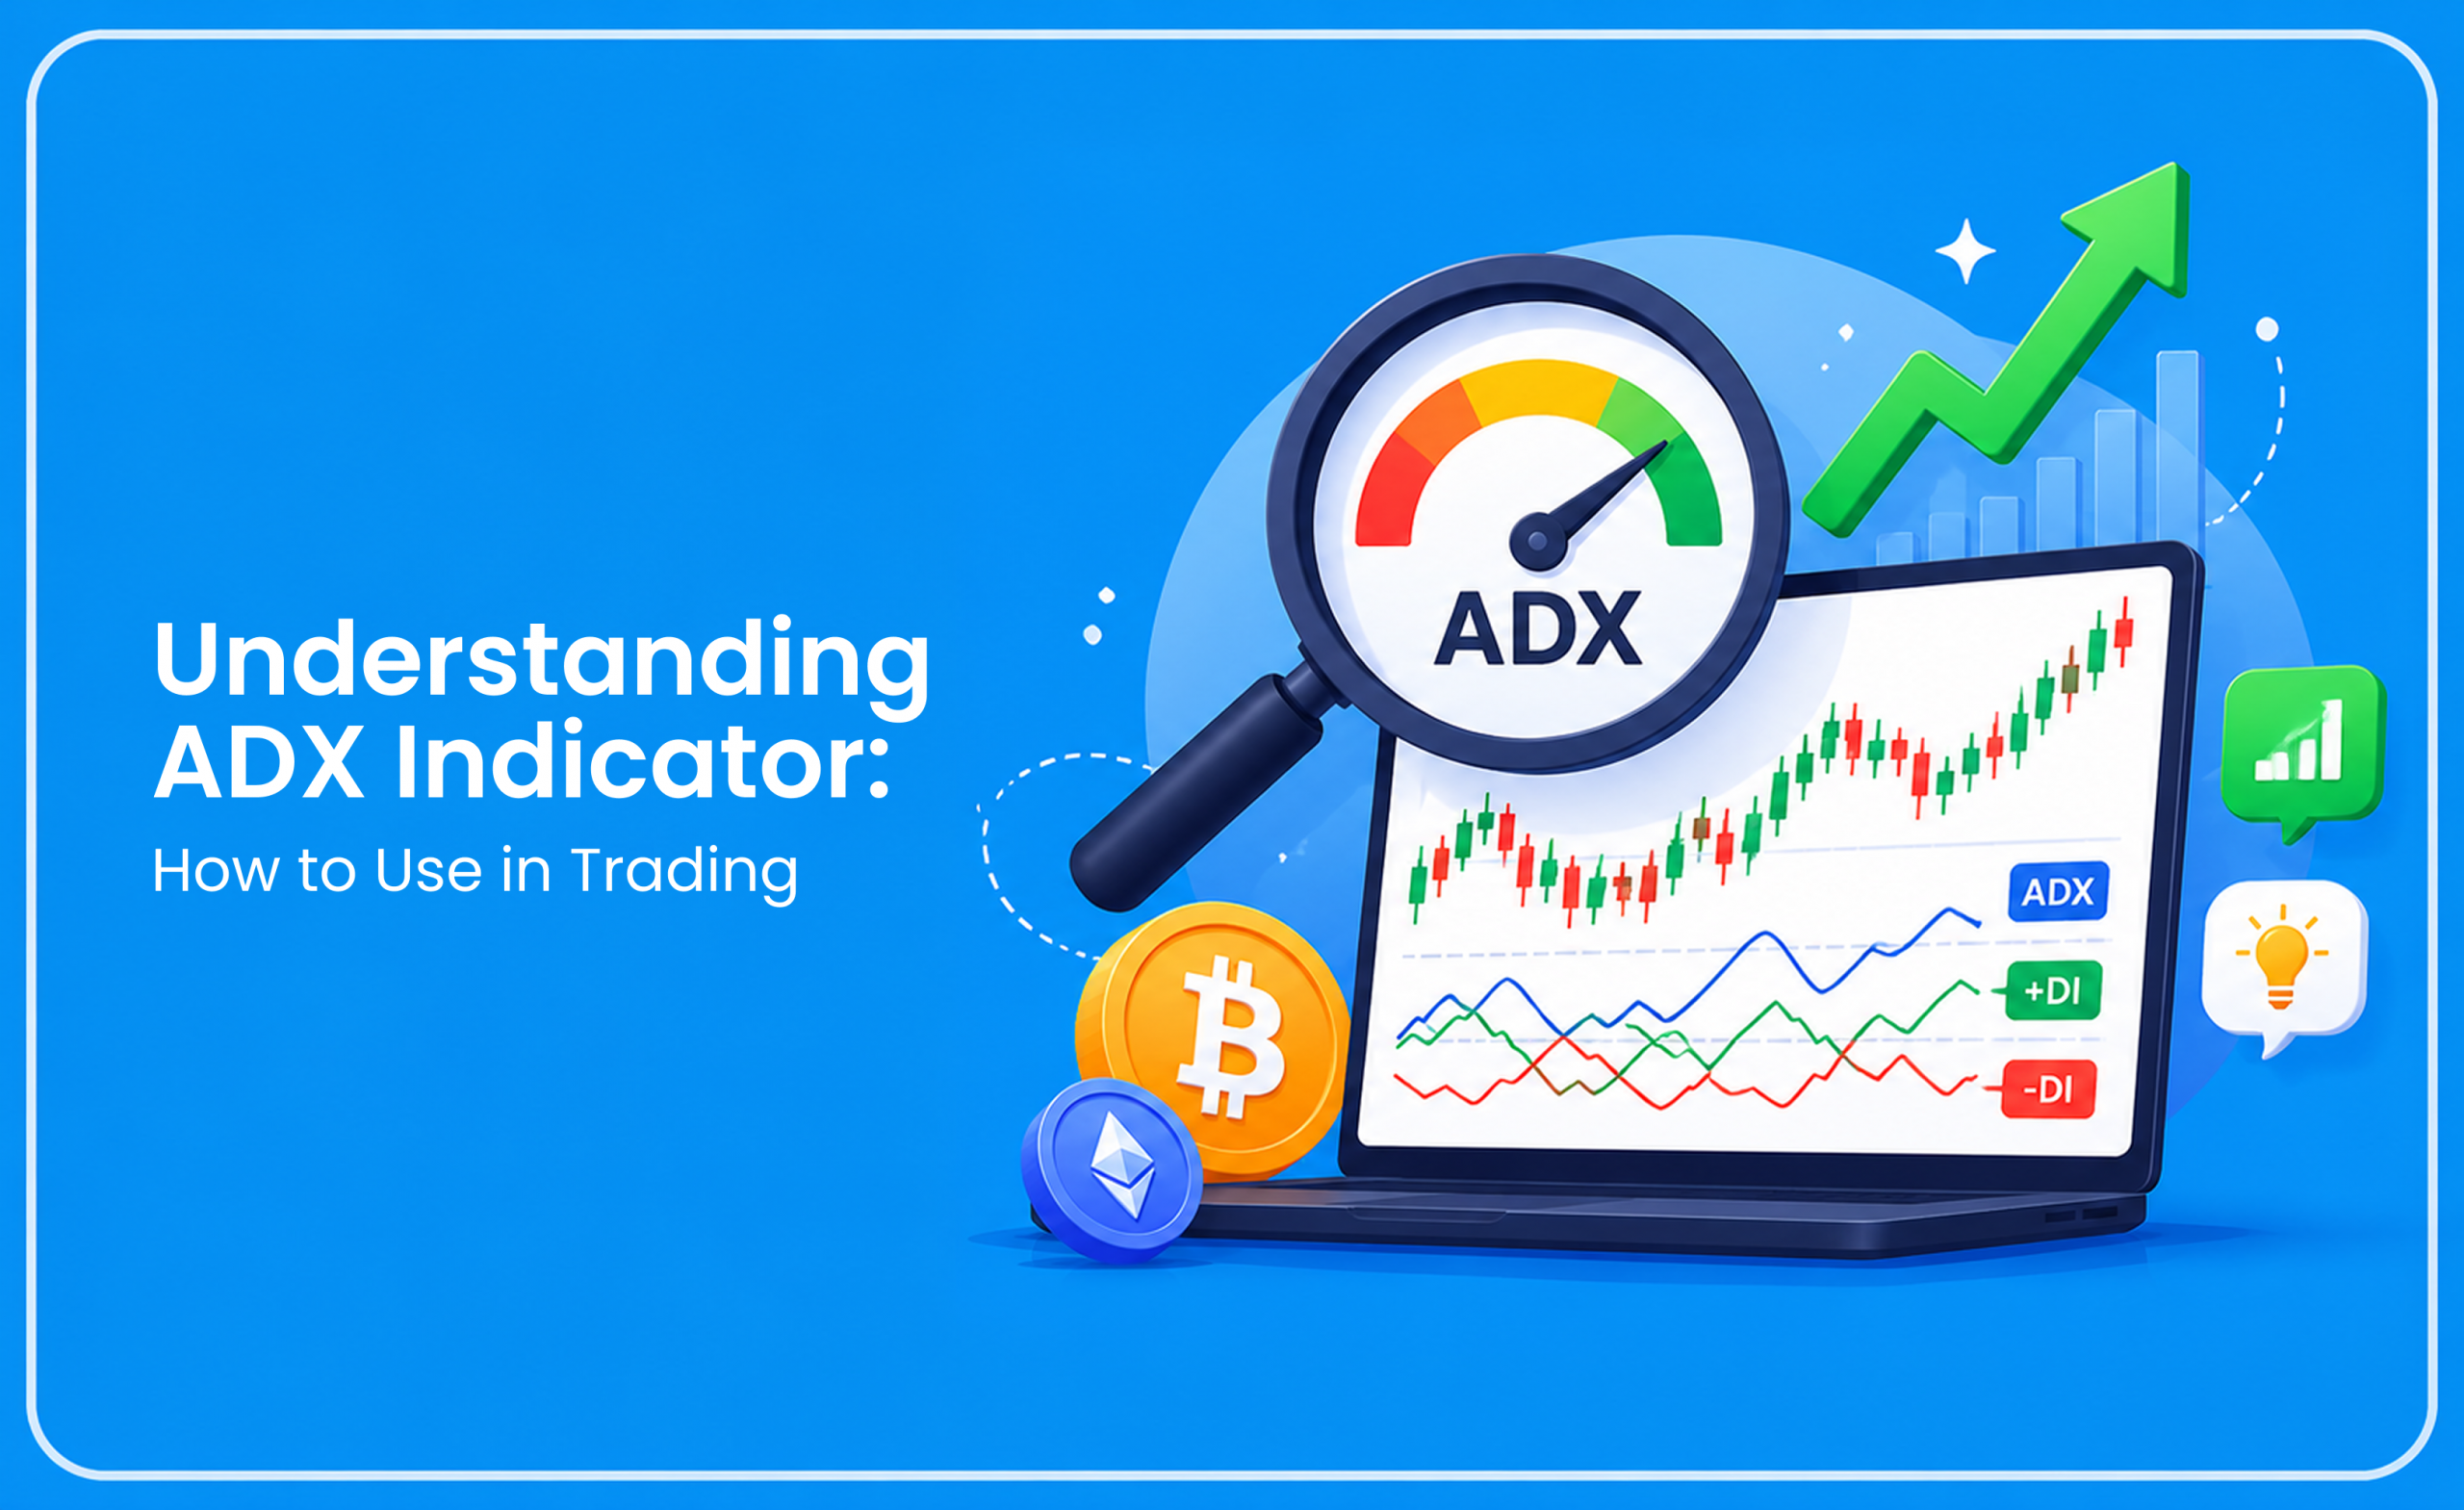
The indicator plots three lines:
- ADX line: The primary line, ranging from 0 to 100, measures trend strength.
- +DI line: The Positive Directional Indicator, showing upward price pressure.
- −DI line: The Negative Directional Indicator, reflecting downward price pressure.
When +DI sits above −DI, bullish momentum dominates. When −DI sits above +DI, bearish momentum takes place. The ADX line then shows how strong that dominance is.
How to Read the ADX Indicator
The ADX indicator displays value thresholds and what each range reflects about market conditions.
- Below 20: The market lacks trend conviction. Price is likely consolidating or ranging sideways.
- 20–25: A borderline zone. A potential trend may be forming, but confirmation is recommended before committing.
- 25–40: A confirmed trend is in motion. This is the primary zone where trend-following strategies may perform well.
- 40–60: The trend is strong and accelerating. Momentum traders often maximise exposure here.
- Above 60: An extreme trend that is rare, but indicative of powerful directional momentum.
How to Use the ADX Indicator in Trading
- The best way is to use the ADX to decide whether a trend-following approach or a range-bound approach is better for current conditions.
- The ADX also functions as a position management tool. When ADX begins to fall from elevated levels, trend momentum is fading.
The ADX offers a reliable first filter for crypto trading for beginners.
ADX Indicator Strategy
Breakout Confirmation Strategy
Identify periods of low ADX (below 20). When price breaks out of that range, and ADX rises above 25, the signal reflects genuine momentum. Entering after this can help avoid false breakouts.
DI Crossover Strategy
Entries are triggered when the +DI and −DI cross to signal a directional shift, followed by the ADX rising above 25 to confirm the trend’s strength. A +DI crossing above −DI signals a long trade; a −DI crossing above +DI signals a short trade.
ADX + Moving Average Trend Strategy
Combining the ADX with a 50-period EMA provides both direction and strength. A bullish setup exists when the price is above the EMA, +DI exceeds −DI, and ADX reads above 25. A bearish setup does similarly on the downside. This helps identify weaker signals.
Comparing this tool with volume-based indicators such as the OBV indicator offers complementary insights.
Best ADX Settings for Different Timeframes
Selecting the right setting is essential when learning how to use the ADX indicator for day trading. The default 14-period setting is the most widely used, but adjustments matter.
- 5-minute charts: The best ADX setting for 5 minutes chart is a period of 7 to 14. A 7-period ADX reacts swiftly to price changes but generates more false signals.
- 15-minute to 1-hour charts: The standard 14-period setting works well here.
- Daily and 4-hour charts (swing trading): The best ADX settings for swing traders lean towards 14 to 20 periods.
Which Indicator Works Best With ADX?
It depends on what additional information the trader needs.
- RSI (Relative Strength Index): ADX confirms trend strength; RSI identifies overbought or oversold extremes within that trend.
- MACD: MACD detects potential trend reversals. Pairing a MACD crossover with an ADX reading above 25 reduces false reversals.
- Moving Averages (EMA/SMA): A moving average shows whether price is above or below its average. ADX confirms whether that bias reflects enough strength to trade.
- CMF Indicator (Chaikin Money Flow): CMF indicator readings reveal whether money is flowing into or out of an asset. Pairing CMF with ADX offers a volume-weighted angle for trend strength analysis.
Harnessing the Power of the ADX Indicator on Shark Exchange
The value of an ADX indicator lies in confirming when a market is worth following. Combined with directional tools, it lays the foundation for an evidence-based trading approach.
Traders wanting to apply the ADX indicator across crypto derivatives can explore Shark Exchange. We are a USDT-only futures and options platform offering low fees in the market, up to 150x leverage, and the execution framework that precision strategies require.
FAQ – ADX Indicator
What is the ADX indicator in trading?
The ADX (Average Directional Index) is a technical analysis tool developed by J. Welles Wilder that measures the strength of a market trend, regardless of whether the trend is upward or downward.
How does the ADX indicator work?
The ADX uses three lines: the ADX line (trend strength), +DI (bullish pressure), and −DI (bearish pressure). It shows how strong a trend is, while the +DI and −DI indicate direction.
What do ADX values indicate?
ADX values help identify market conditions: below 20 signals a weak or sideways market, 25–40 indicates a strong trend, and above 40 reflects very strong momentum.
How do you use the ADX indicator in trading?
The ADX helps traders decide whether to follow a trend or trade a range. Rising ADX suggests strengthening momentum, while falling ADX indicates a weakening trend.
What is the best ADX setting for trading?
The default 14-period setting is most common. Short-term traders may use 7–14 periods, while swing traders often prefer 14–20 periods for smoother signals.
Which indicators work best with ADX?
ADX is often combined with RSI for overbought/oversold signals, MACD for trend reversals, and moving averages to confirm direction along with trend strength.
What is a simple ADX trading strategy?
A common approach is using DI crossovers with ADX above 25 to confirm trend strength, or entering breakouts when ADX rises from low levels, indicating momentum.